Concepts and Cognitive Psychology
Psychologists who specialize in learning and teaching have developed a technique called “concept mapping,” which is used in both elementary and higher levels of education with very good results. Concept maps are visual structures, which are easy to communicate. Consequently, they are a good platform for sharing user stories, which help us determine the requirements of the business.
Cognition is spatial. There are strong indications that our perception and recall capabilities are derived from our innate ability to visually process our environment. In other words, spatial structures are what matter most to our brains. On one side, this pushes analysts in the direction of visualization. On the other, it suggests we work with multidimensional coordinates. You’ll often hear the term “conceptual spaces” tossed around in this regard.
Visualization must be emphasized. It is really a powerful thing. Visual perception works on approximations, which makes sense from an evolutionary standpoint; if you were in the jungle and noticed something that might be a tiger, well, might was good enough for you to run. In this way, our perceptive systems have been strengthened by millions of years of evolution and now work quite well—even on erroneous input; as in the following example:
Rinadeg Oedrr -
Aoccdrnig to a rscarhee at Cigdmabre Uinervtisy, it deosn t mtetar in waht oredr the ltteers in a wrod are, the olny iprmoatnt tihng is taht the fnst and lsat ltteer be at the rghit pclae. The rset can be a taotl mses and you can sit11 raed it wouthit porbelm. Tihs is bcuseae the huamn mnid deos not raed ervey lteter by istlef, but the wrod as a wlohe.
Interactive Data Visualization: Foundation, Techniques and Applications. Second Edition, by M.O. Ward, G. Grinstein, D.Keim, CRC Press 2015.
This brings us to the multidimensional aspect of data. The success of the multidimensional data model in business intelligence and analytics is overwhelming. Thinking dimensionally seems to come quite naturally to us. This is probably because dimensional thinking is very similar to spatial cognition. At the “junction” of several dimensions, you find the information you need. So, multidimensional solutions give natural answers to the key question of location:
“Where is this?”
In fact, a “location” in a context is nothing more than multidimensional coordinates. Spatial thinking is again working wonders.
Powerful communication can be achieved using the brain’s physical senses. We rely on visual information for about 80% of our situational perception; clearly, using visualization in communication is a must. Brains are built, not least, for navigation. That is why structured representations in 3-dimensional space are generally the most effective visual tools.
Cognitive psychology has surveyed our cognitive biases carefully. There is much to pay attention to, and visualization of structure and and meaning is imperative!
It is more important than ever to understand how people think. If you have ever been in a tense meeting or negotiation you know how difficult it can be to communicate effectively and agree to terms. If you reach out to many people, as we do in business analysis and Big Data analytics, human psychology may be the biggest factor to consider.
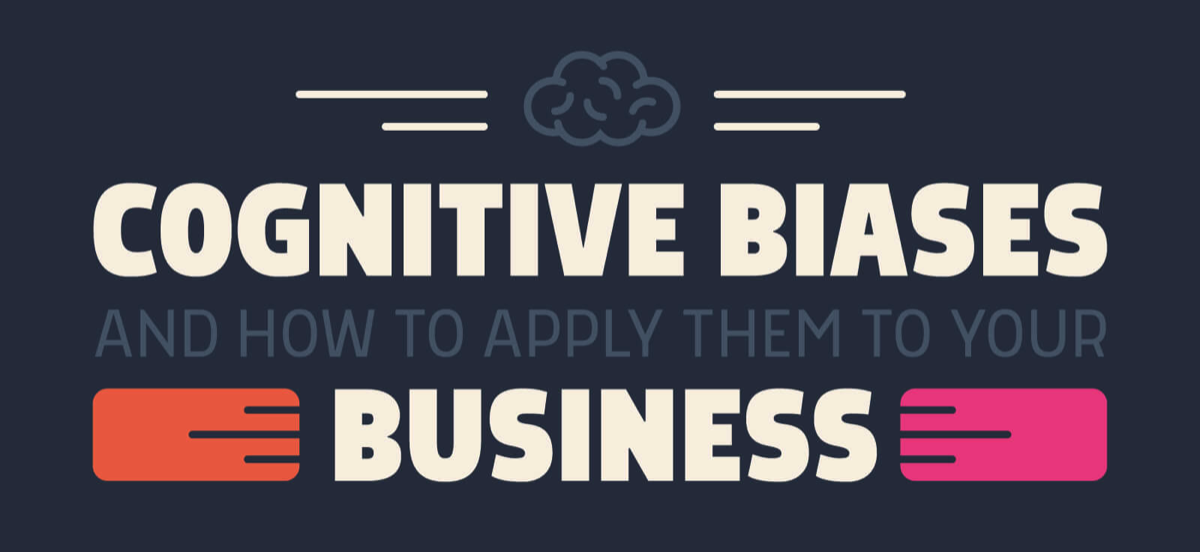
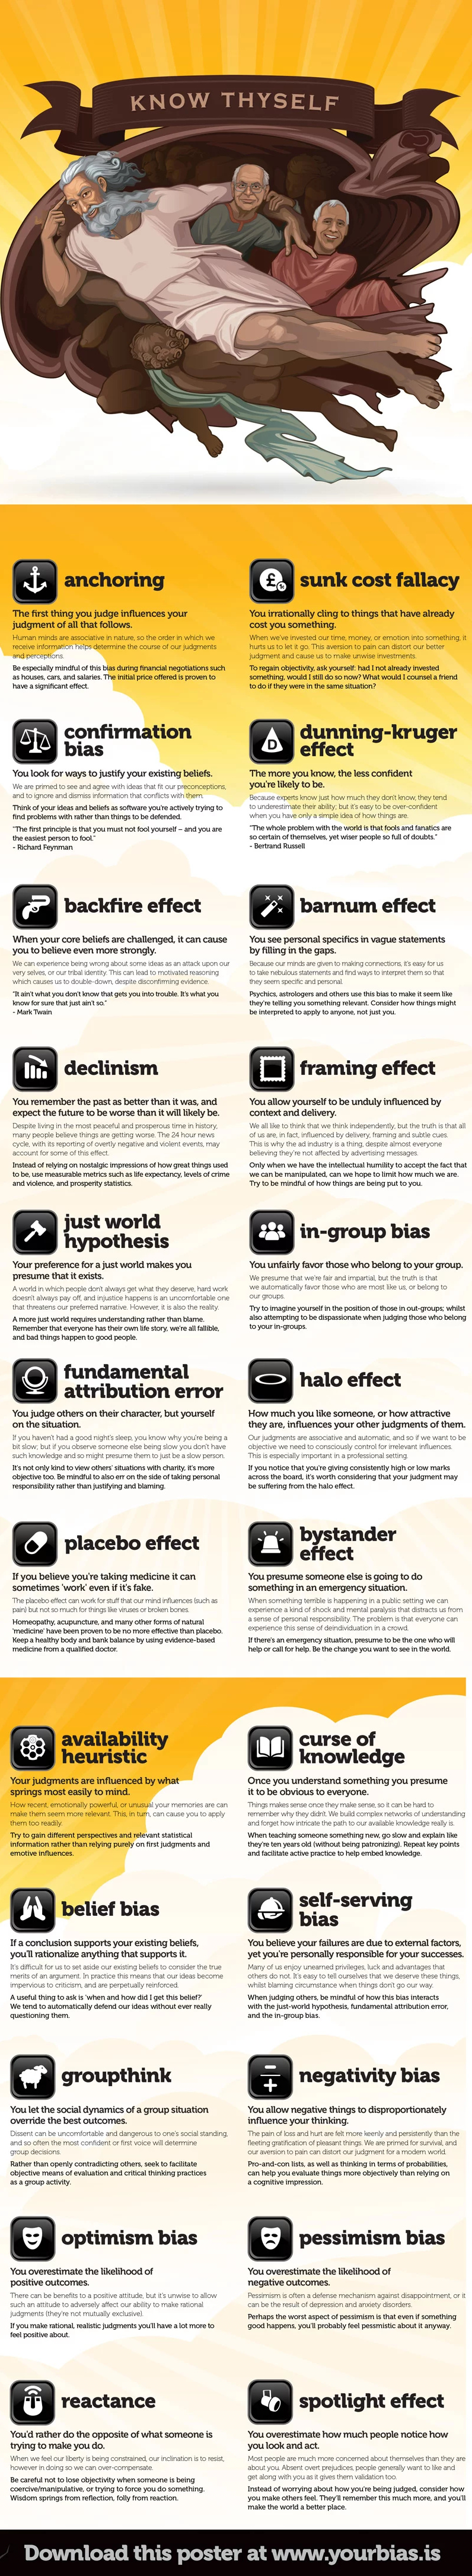
The human brain is not only influenced by its genetic predispositions but also by the previous experiences and cognitive biases that in one way or another effect nearly everyone’s decision making. If you have ever wondered how cognitive biases impact business then recommend that you look in to this in more detail. This visual from GetVoIP covers 25 of the most common cognitive biases and how they are leveraged in business:
Cognitive psychology has surveyed our cognitive biases carefully. There is much to pay attention to, and visualization of structure and and meaning is imperative!
It is more important than ever to understand how people think. If you have ever been in a tense meeting or negotiation you know how difficult it can be to communicate effectively and agree to terms. If you reach out to many people, as we do in business analysis and Big Data analytics, human psychology may be the biggest factor to consider.
The human brain is not only influenced by its genetic predispositions but also by the previous experiences and cognitive biases that in one way or another effect nearly everyone’s decision making. If you have ever wondered how cognitive biases impact business then recommend that you look in to this in more detail. This visual from GetVoIP covers 25 of the most common cognitive biases and how they are leveraged in business:
Another good overview of known cognitive biases can be found in this infographic.
As well as in this infographic from The Visual Capitalist.
As well as in this infographic from The Visual Capitalist.
Another insightful book on how to map reality is:
Data and Reality, by William Kent. Buy it here, using the coupon code 'VizDataModeler' will give you 20 % off!
Data and Reality, by William Kent. Buy it here, using the coupon code 'VizDataModeler' will give you 20 % off!
Concept mapping comes from the field of learning psychology, and has proven to be useful to both business experts and business analysts.
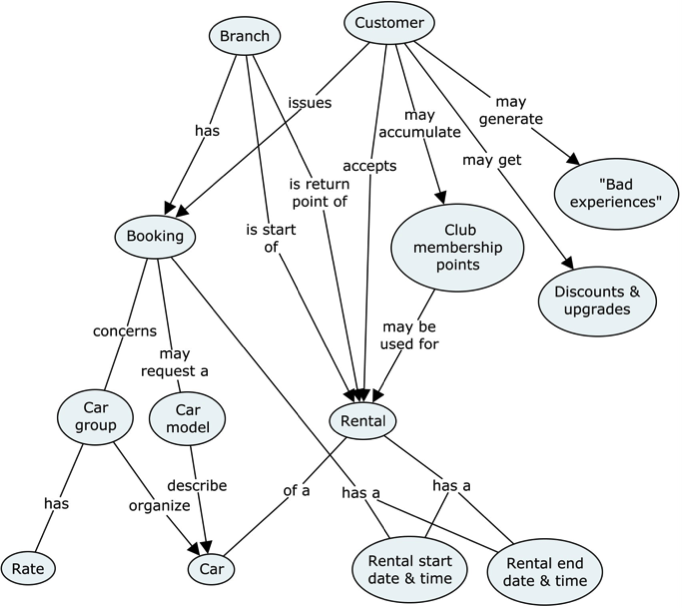
Let us examine a simple example: The EU-Rent Car Rental.
(The EU-Rent Car Rental is a fictitious business used in the OMG documentation for the Semantics for Business Rules and Vocabulary standard, SBVR, (http://bit.ly/2abzjp7). The EU-Rent case study was developed by Model Systems, Ltd., along with several other organizations of the Business Rules Group (www.businessrulegroup.com), and has been used by many organizations. The body of descriptions and examples may be freely used, providing its source is clearly acknowledged.)
The user story goes as follows:
EU-Rent rents cars to its customers. Customers may be individuals or companies.
Different models of cars are offered, organized into groups. All cars in a group are charged at the same rate.
A car may be rented by a booking made in advance or by a ‘walk-in’ customer on the day of rental. A rental booking specifies the car group required, the start and end dates/times of the rental and the EU-Rent branch from which the rental is to start. Optionally, the reservation may specify a one-way rental (in which the car is returned to a branch different from the pick-up branch) and may request a specific car model within the required group.
EU-Rent has a loyalty club. Customers who join accumulate points that they can use to pay for rentals. EU-Rent from time to time offers discounts and free upgrades, subject to conditions.
EU-Rent records ‘bad experiences’ with customers (such as unauthorized late return from rental, or damage to car during rental) and may refuse subsequent rental reservations from such customers.
The text above is pretty clear and well written. However, experience has shown that representing the same information in as a concept model will make it more intuitive to read and understand. The diagram below represents almost all of the information in the text above:
The discovery and mapping of business concepts is an iterative process. First you establish a high level overview of the most important concepts.
From there, you must break down the objects shown on the overview, adding more detailed information. You may also “roll up” concepts and properties from forms and database descriptions, from the bottom up. You could, for example, look at a booking form and transfer the fields found on that to the concept map. Doing this adds more detail and in practice you work in a combination of topdown and bottom-up, depending on which information is available.
By the way: Data Profiling and Machine Learning are candidates for using software to extract concepts from all kinds of sources, be they structured databases or documents.
Add the end of this process you now possess good information about the business concepts and their basic structure.
Draw Concept Models using CmapTools from IHMC
Some of the concept maps on this site are drawn with the product CmapTools. It is available from this website http://cmap.ihmc.us. Please note that the basic IHMC CmapTools software is free for educational institutions and US Federal Government Agencies, and at this time, the software is being offered free as a beta test version to other users, including commercial users.
You may follow the sequence or explore the site as you wish:
You could also take a look at the book about Business Concept Mapping:
Since it was published in 2012 this book has had more than 50K chapter downloads in research libraries all over the world. This makes it part of top 25% in its category!
Graphs are, actually, used for modeling business facing concept models in front of the design oriented solution models.
Steve Hoberman, the Data Model Rockstar, has written an excellent book about that:
The Rosedata Stone: Achieving a Common Business Language using the Business Terms Model, by Steve Hoberman, buy it using the coupon code: 'VizDataModeler' (worth 20 %), at Technics Pub.
I have developed a design thinking inspired approach, which is described here.
